Brandon’s diverse and reliable workforce provides companies with the talent they need to develop and produce a wide range of products. This diverse business economy also creates overlapping opportunities for companies to supply or source goods and services across multiple sectors of industry.
The City of Brandon and the surrounding rural areas differ considerably in employment structure by industry. Brandon's economy is more diversified in that the regionally dominant primary industry is a small component, while the service functions associated with a wholesale-retail trade centre are dominant. Brandon also has an extensive business, education, finance and administrative sector, reflecting its role as Manitoba's second largest city.
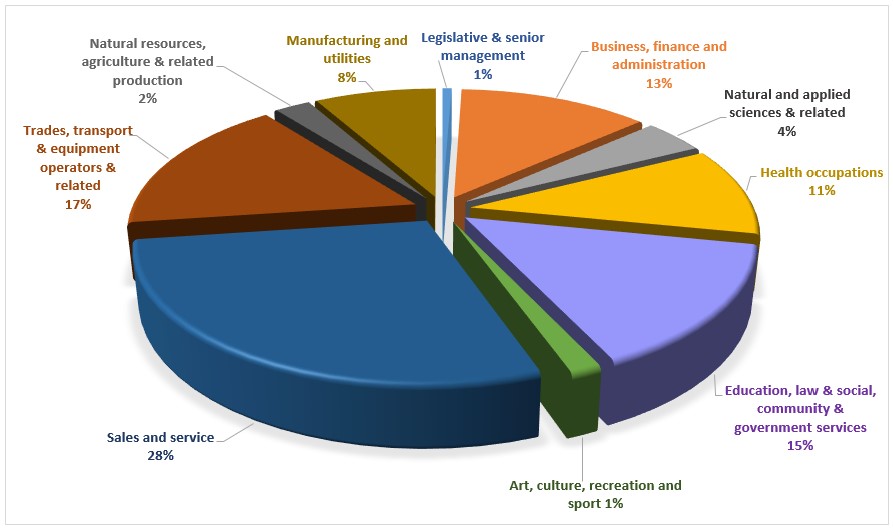
Employment by Industry Sector 2021 Moving Average
15 years and over, Brandon (CY)
| Industry | Male | Female | Brandon Total | Canada | |
| Total - Experienced labour force | 14,250 | 13,160 | 27,405 | 19,310,340 | |
| Sales and service occupations | 3,305 | 4,300 | 7,610 | 28% | 24% |
| Trades, transport and equipment operators and related occupations | 4,240 | 225 | 4,460 | 16% | 17% |
| Education, law and social, community and government services | 1,635 | 2,360 | 3,990 | 15% | 12% |
| Business, finance and administration occupations | 1,010 | 2,420 | 3,435 | 13% | 17% |
| Health occupations | 635 | 2,205 | 2,845 | 10% | 8% |
| Occupations in manufacturing and utilities | 1,515 | 675 | 2,195 | 8% | 4% |
| Natural and applied sciences and related occupations | 885 | 225 | 1,110 | 4% | 8% |
| Natural resources, agriculture and related production occupations | 520 | 125 | 640 | 2% | 3% |
| Occupations in art, culture, recreation and sport | 195 | 215 | 405 | 1% | 3% |
| Legislative and senior management occupations | 90 | 75 | 165 | .5% | 1% |
| Occupation - not applicable | 225 | 340 | 565 | 2.5% | 2.5% |
Source: Statistics Canada, 2021 Census of Population.
Calculations may vary due to rounding
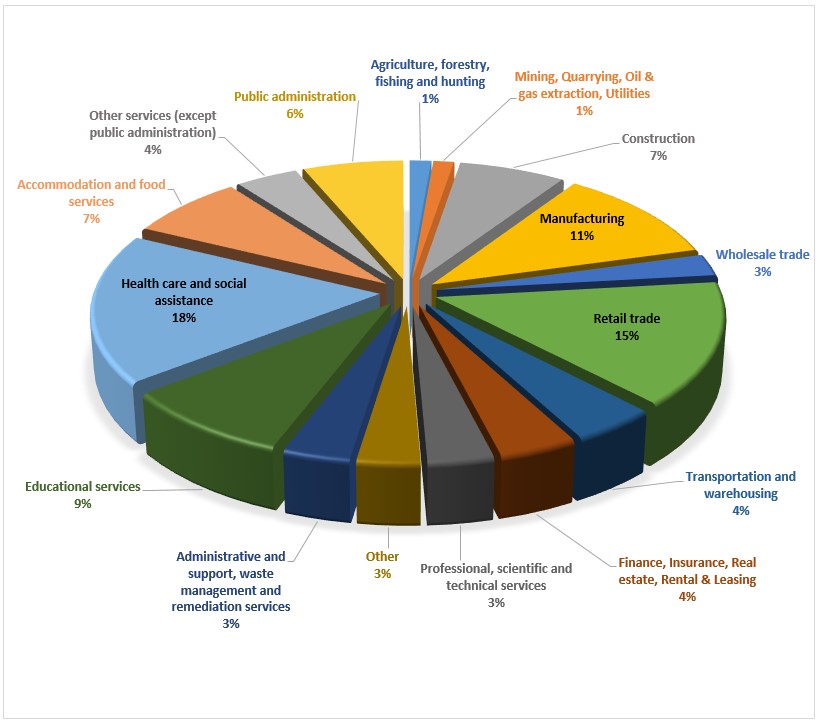
Employment by Occupation 2021 Moving Average
15 years and older, Brandon (CY)
| Occupation | Male | Female | Brandon Total | Canada | |
| Total - Experienced labour force | 14,250 | 13,160 | 27,405 | 19,310,340 | |
| Health care and social assistance | 1,025 | 3,700 | 4,725 | 17% | 13% |
| Retail trade | 1,935 | 1,965 | 3,905 | 14% | 11% |
| Manufacturing | 2,145 | 875 | 3,020 | 11% | 8% |
| Educational services | 835 | 1,505 | 2,340 | 9% | 7% |
| Accommodation and food services | 830 | 1,170 | 2,005 | 7% | 6% |
| Construction | 1,625 | 190 | 1,815 | 7% | 8% |
| Public administration | 1,120 | 595 | 1,715 | 6% | 6% |
| Transportation and warehousing | 1,005 | 145 | 1,150 | 4% | 5% |
| Other services (except public administration) | 565 | 500 | 1,065 | 4% | 4% |
| Finance, Insurance, Real estate, Rental & Leasing | 420 | 640 | 1,060 | 4% | 6% |
| Wholesale trade | 535 | 150 | 685 | 3% | 3% |
| Administrative & support, waste management & remediation services | 480 | 430 | 910 | 3% | 4% |
| Professional, scientific and technical services | 445 | 440 | 890 | 3% | 8% |
| Agriculture, forestry, fishing and hunting | 270 | 100 | 365 | 1% | 2% |
| Mining, Quarrying, Oil & gas extraction, Utilities | 325 | 25 | 350 | 1% | 2% |
| Other | 465 | 385 | 850 | 3% | 4% |
| Occupation - not applicable | 225 | 340 | 565 | 2% | 2% |
Source: Statistics Canada, 2021 Census of Population.
Calculations may vary due to rounding

